Monitoring Confluence to SharePoint Migration Progress - Overview
How to monitor the progress of migration from Confluence to SharePoint? This article explains how.
There are several places to get insights into the migration progress.
View per-page success metrics
To view migrated pages and to check the migration result per page, you go to the Site Pages library of each migration target site.
Learn more here about the metrics you find there for each page: Per-page progress.
View how many pages have been migrated per selector (e.g. per space)
To learn how many pages have already been migrated for a space - or any other selector - and how many pages are yet to be migrated, you look at the progress log files.
The overall number of pages per selector as well as the number of already migrated pages is also written back to the Space Inventory list (note: starting with WikiTraccs v1.22.1). Look at this SharePoint list to get a quick overview of page counts.
Learn more here: Per-selector progress.
General insights into warnings and errors
Warnings and errors that occurred during the migration are written to the common log files.
Filter those log files for messages marked with WRN and ERR.
Live progress indicators
When running a migration, there are certain numbers shown in the blue WikiTraccs.GUI window, in the black console window, and in the log file. Those numbers show how fast the migration is currently going.
Learn more here: Live Progress Indicators.
1 - Monitoring Per Page Progress
How to get page migration success metrics for each page.
The Site Pages library of every target space contains migrated pages and metadata.
Use the library view Recent Pages (WikiTraccs) to gain insights into the migration success for every single page. The SharePoint page’s metadata also includes the space key and content ID.
Read more about the different metrics here: Measuring page migration success.
2 - Monitoring Per Selector Progress
This article explains how to get higher-level insights into the migration progress, by looking at each selector and how many pages have been migrated, and how many are still missing.
Note
Selectors are used to tell WikiTraccs which content to migrate, for example “migrate all pages of space X”. Have a look at the
selector documentation to learn about the different selector types.
Quick Glance via Space Inventory
Note: This feature is available since WikiTraccs v1.22.11 (released in December ‘24).
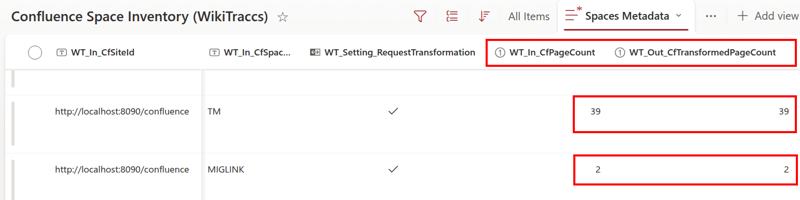
After your first migration, the Space Inventory shows the overall number of pages per selector and the number of pages migrated to SharePoint.
The two list columns to look out for are:
WT_In_CfPageCount - the number of pages found in ConfluenceWT_Out_CfTransformedPageCount - the number migrated pages found in SharePoint Online
Log files containing information about the Confluence to SharePoint migration progress.
Note: You might have to add the columns to the current list view of the space inventory list, if they are not already visible.
Initially, those fields are empty and show no number.
WikiTraccs updates the numbers when starting a migration run and when finishing a migration run. All selectors that are included in the migration run (those with a check mark set in the WT_Setting_RequestTransformation column) will be updated.
If WT_In_CfPageCount and WT_Out_CfTransformedPageCount are equal, all pages of that selector probably have been migrated. Note that this hides edge cases like “one newly created Confluence page has not been migrated, yet, and a previously migrated page has been deleted in Confluence”; this case would also show the same page count in both columns.
To get deeper insights, refer to the next section and the progress log files.
Using Progress Log Files to Get Insights
Note
Depending on whether you are running WikiTraccs.GUI or WikiTraccs.Console log files will be stored at different locations.
When using WikiTraccs.GUI, look at the WikiTraccs.GUI\logs folder. When using WikiTraccs.Console, look at the WikiTraccs.Console\logs folder.
Progress log files are stored in a sub folder that has the current date as its name, e.g. logs\2023-05-19.
As of release v1.1.0 WikiTraccs provides information about the migration progress in different progress-related log files:
Log files containing information about the Confluence to SharePoint migration progress.
The information you can gather from these files is:
- How many pages are scheduled to be migrated?
- Which pages have already been migrated to SharePoint?
- Which pages are yet to be migrated?
- Which pages have been migrated but need an update?
See below for a quick rundown of the log files and their content.
The values in those files are separated by tabulator. So it’s nearly CSV, but with tab instead of comma. The file name contains a timestamp, the Confluence site ID as specified in the configuration, the space key, and the last part of the target SharePoint site URL.
Progress Log File Documentation
Note
Multiple progress log files will be created with each migration run.
When starting the migration from Confluence to SharePoint WikiTraccs creates progress log files for each analyzed selector. Those reflect the state before the migration of a selector.
After migrating all scheduled selectors WikiTraccs creates a second batch of progress log files for each selector that had pages migrated for. This will be done when going into idle mode. You may interrupt this if you don’t need those files.
When pressing Ctrl+C in WikiTraccs.Console (to cancel the running operation) it is not guaranteed that the final batch of progress log files will be generated. To get the current state just start the migration again and the files will be generated for each scheduled selector.
Keep an eye on the file name and timestamp when you search for the most recent progress log files.
Note
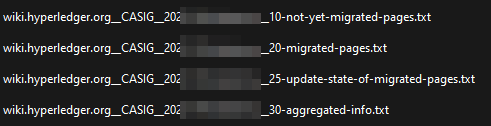
The content of these files is subject to change as customer feedback keeps coming in, pointing to additional information that would be valuable.xxx__10-not-yet-migrated-pages.txt
This file contains information about Confluence pages that are yet to be migrated.
Sample content:
CASIG	78022359	CA2SIG - Meeting November 29	/display/CASIG/CA2SIG+-+Meeting+November+29
CASIG	78022377	2022-11-22 Standard WG	/display/CASIG/2022-11-22+Standard+WG
CASIG	80773916	2022 12 06 Standards WG	/display/CASIG/2022+12+06+Standards+WG
The tab-separated columns in this file are:
- Confluence space key
- Confluence page ID
- Confluence page title
- Confluence page URL
xxx__20-migrated-pages
This file contains information about migrated pages. It contains information about existing Confluence pages where a corresponding SharePoint page exists as well.
Sample content:
CASIG	24781062	Climate Action and Accounting SIG Home	/display/CASIG/Climate+Action+and+Accounting+SIG+Home	97652
CASIG	24781122	Meetings	/display/CASIG/Meetings	97653
CASIG	24781124	Member Directory	/display/CASIG/Member+Directory	97654
The tab-separated columns in this file are:
- Confluence space key
- Confluence page ID
- Confluence page title
- Confluence page URL
- SharePoint page ID (in the Site Pages library)
xxx__25-update-state-of-migrated-pages
This file contains information about the freshness of migrated pages.
Note
The file format changed with WikiTraccs release v1.7.Sample content:
+++
SourceTenantId = "https://confluence.contoso.com/"
PageSelectorType = "ConfluenceSpace"
PageSelector = "CASIG"
CreationDateUtc = 2023-01-21T15:30:07.1691711
SchemaVersion = 2
+++
CASIG	Page	78022313	2022-11-21 Peer Programming Call	/display/CASIG/2022-11-21+Peer+Programming+Call	2022-11-30T22:17:28	2022-11-29T23:17:28 2022-11-29T23:17:28	needsupdate
CASIG	Page	78022335	CA2 SIG - Meeting November 15	/display/CASIG/CA2+SIG+-+Meeting+November+15	2022-11-24T06:52:40	2022-11-24T06:52:40 2022-11-29T23:17:28	uptodate
CASIG	Page	78022347	CA2 SIG - Meeting December 13	/display/CASIG/CA2+SIG+-+Meeting+December+13	2022-12-14T01:46:57	2022-12-14T01:46:57 2022-11-29T23:17:28	uptodate
The file contains a header that is enclosed with +++.
Following the header, the list of page update states starts.
The tab-separated columns are:
- Confluence space key
- Confluence content type: Page or Blogpost
- Confluence page ID
- Confluence page title
- Confluence page URL
- Modification date of the Confluence page
- Stored modification date of the migrated page in SharePoint (this is the Confluence page modification date at the time of migration)
- Modification date of the SharePoint page (note: added in release v1.12.24)
- State of the SharePoint page
- uptodate: this page is up to date
- needsupdate: this page has been updated in Confluence since its migration
- cannotdetermine: metadata in SharePoint is missing, cannot determine if update is needed
Note: WikiTraccs will output additional state values in a verification run.
xxx__30-aggregated-info
This file contains information that could be gathered from the other files, but already aggregated:
Sample content:
Source Confluence Site: https://wiki.hyperledger.org
Target SharePoint Site: https://contoso.sharepoint.com/sites/migration-target
Space Key: CASIG
Blog posts included in migration and calculation: no
Confluence page count for space space CASIG: 292
Migrated SharePoint pages that correspond to found Confluence pages in space CASIG: 259
Migrated SharePoint pages overall for space CASIG: 259
Pages yet to be migrated for space CASIG: 33
If Migrated SharePoint pages overall for space is larger than Migrated SharePoint pages that correspond to found Confluence pages in space then pages turned inaccessible in Confluence (deleted? permission denied?) but the once-migrated pages in SharePoint still exist.
Progress Log File Cadence
WikiTraccs creates progress log files at specific times:
- when starting a migration run - log files for each scheduled selector will be created
- when stopping a running migration run by pressing Ctrl+C in the console window of WikiTraccs.Console - log files for each selector handled so far will be created
- when the migration run is done - log files for each selector handled so far will be created
This means that multiple progress log files per selector will be created. Look at the ones with the most recent timestamp to see the latest progress information.
Note
WikiTraccs does not create a file if there is nothing to log. So some progress log files can be missing and that’s expected.You can delete or archive old progress log files. Every new migration run will create new files.
Troubleshooting Missing Pages
Have a look at the troubleshooting recipe: Find out why some pages won’t migrate.
3 - Live Progress Indicators
How to interpret live progress indicators shown by WikiTraccs.
Speed metrics in the blue WikiTraccs.GUI window
Note: those metrics are available as of WikiTraccs 1.22.1
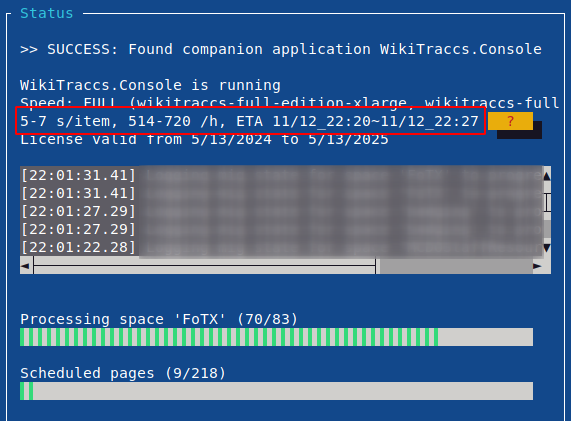
After migrating a couple of pages, WikiTraccs shows speed metrics:
The meaning is the following:
5-7 s/item: the page migration time in the last n minutes was 5 to 7 seconds per page514-720 /h: the estimated number of pages that will be migrated in the next hourETA 11/12 22:20 ~ 11/12 22:27 the estimated finish time
For each of the above, one value is based on mean page migration times, the other value is based on the 75th percentile. WikiTraccs removes outliers by disregarding very fast and very slow pages, using the interquartile range algorithm. Values are calculated over a period of 60 minutes.
With each migrated page the values will be updated.
Those values will change over the course of the migration. If the migration starts with pages that have no attachments, you might see great migration times of maybe 5 seconds per page. But if suddenly pages start to have dozens of attachments, each a couple of megabytes in size, times will go up.
Black console window and log files
Looking at the black console window you’ll get more numbers than in the blue WikiTraccs.GUI window.
You can see those numbers in the common log files as well, as everything shown in the console window is stored there. You can open and look at those log files while the migration is running.
Live metrics calculated after each migrated page
Note: those metrics are available as of WikiTraccs 1.22.1
Note: as WikiTraccs evolves, the available metrics and wording will change and evolve as well.
WikiTraccs measures the time it spends on different migration-related activities. Different metrics are calculated from thsoe times.
Those metrics are supposed to roughly show how fast the migration is going over a period of time, as well as some additional insights. This can predict future migration times, but only if pages are similar with respect to certain metrics.
Here’s a sample:
[023 21:32:46 DBG MIG  ] [https://contoso.atlassian.net/wiki] Metrics FROM THE LAST 60 MINUTES, covering 21 page-like contents ("items"):
Median time (IQR)    : 23 s/item
Median time          : 55 s/item
75th percentile (IQR): 87 s/item
75th percentile      : 132 s/item
Mean time (IQR)      : 68 s/item
Mean time            : 90 s/item
Items per hour       : 41-156 (based on IQR Median and IQR 75th percentile)
Avg links transformed: 2/item
Have files           : 59% of items
File count avg       : 23.9 per item that has files
File size avg        : 502 KB/file
Download speed       : ~451 KB/s
Upload speed         : ~91 KB/s
File size sum down   : 305.8 MB
File size sum up     : 1911.6 MB
Estimated time left for the remaining 322 items: 2.1-7.8 hours (ETA: 12/11/2024 23:36 - 12/12/2024 05:19) (based on IQR Median and 75th percentile)
[023 21:32:46 DBG MIG  ] [https://contoso.atlassian.net/wiki] Time spent in the last 60 minutes (excerpt, overlapping, excluding outliers):
(SharePoint, File, Content)                                 : 11.58 min
(Confluence, File, Content)                                 : 3.19 min
(SharePoint, Page, Content)                                 : 2.03 min
(Confluence, Page, Transformation_Macro_Other)              : 1.57 min
(Confluence, Page, Link_Soft)                               : 0.97 min
(SharePoint, WikiTraccs, Prerequisites)                     : 0.67 min
(SharePoint, Page, Principal)                               : 0.55 min
(Confluence, Page, Principal)                               : 0.47 min
(SharePoint, Page, Metadata)                                : 0.47 min
(SharePoint, File, Metadata)                                : 0.28 min
(SharePoint, Workspace, Metadata)                           : 0.26 min
(Confluence, Page, Transformation_UserMention)              : 0.26 min
(SharePoint, Page, Stub)                                    : 0.25 min
(SharePoint, Page, Configuration)                           : 0.23 min
(Confluence, Page, Link_Hard)                               : 0.21 min
(Confluence, Page, Comments)                                : 0.20 min
(SharePoint, File, Principal)                               : 0.17 min
(Confluence, Page, Permission)                              : 0.14 min
(Confluence, Page, Content)                                 : 0.13 min
(Confluence, Page, Tree)                                    : 0.09 min
Details about above values:
| Metric | Meaning |
|---|
| Median time | Median migration time per page |
| Median time (IQR) | Median migration time per page, after removing outliers |
| 75th percentile | 75th percentile of page migration times |
| 75th percentile (IQR) | 75th percentile of page migration times, after removing outliers |
| Mean time | Average migration time per page |
| Mean time (IQR) | Average migration time per page, after removing outliers |
| Items per hour | Pages migrated per hour, based on IQR Median and IQR 75th percentile |
| Avg links transformed | The average number of links on those pages; links increase migration times |
| Have files | The percentage of pages that have attachments or link to external images |
| File count avg | The average number of files that were uploaded per page (of the pages that have any files) |
| File size avg | The average file size |
| Download speed | Average download speed for downloaded files |
| Upload speed | Average upload speed when uploading files to SharePoint Online; this also includes several metadata operations, so it will be lower that the ‘raw’ file content upload speed would be |
| File size sum down | An indicator of downloaded file content; this is not exhaustive and accuracy will be improved in a future release |
| File size sum up | An indicator of uploaded file content; this is not exhaustive and accuracy will be improved in a future release |
Following those metrics is a list of transformation operations that WikiTraccs spent time on. This is a rough indicator of how much time each operation takes.
Most time will probably be spent on (SharePoint, File, Content), which includes file upload to SharePoint, (Confluence, File, Content), which includes attachment download from Confluence, and (SharePoint, Page, Content), which includes SharePoint page creation.
Those values can and will overlap, so their sum will be higher than the actual time spent. For example uploading page content and resolving links can happen in parallel.
Note
Those values are supposed to make transparent where WikiTraccs spends its time. They could also hint at potential points for optimization.
If you think another metric could be valuable in above list, get in touch, I’d like to hear about your use case.
Live progress for large attachment lists
If WikiTraccs migrates a page with lots of attachments (“lots” being ~50 and more), you will see intermittend progress output like this:
Applied provisioning chunk 3/4; handled 41/53 of files; that's 46.6 files per minute and 0.3 minutes to go
This shows the number of already uploaded files (41 of 53), how many files per minute have been uploaded (46.6), and - based on those numbers - an estimated finish time (in 0.3 minutes).
Note
WikiTraccs optimizes file uploads. Files are uploaded to SharePoint Online in parallel, 2 files at a time.
You can configure more files to be uploaded in parallel, but might get throttled faster by Microsoft. Use the WiggleRoom.ParallelFileOperationsCount configuration parameter in appsettings.json to increase the parallelism count. Experience shows, though, that this doesn’t make much of a difference.