Live Progress Indicators
Speed metrics in the blue WikiTraccs.GUI window
Note: those metrics are available as of WikiTraccs 1.22.1
Note
Those metrics are only available in Migrate content mode.After migrating a couple of pages, WikiTraccs shows speed metrics:
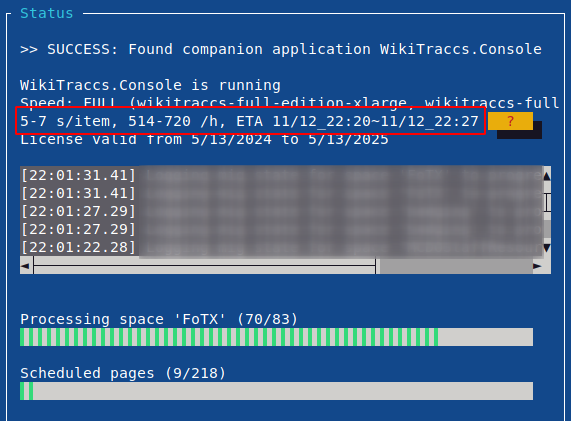
The meaning is the following:
5-7 s/item: the page migration time in the last n minutes was 5 to 7 seconds per page514-720 /h: the estimated number of pages that will be migrated in the next hourETA 11/12 22:20 ~ 11/12 22:27the estimated finish time
For each of the above, one value is based on mean page migration times, the other value is based on the 75th percentile. WikiTraccs removes outliers by disregarding very fast and very slow pages, using the interquartile range algorithm. Values are calculated over a period of 60 minutes.
With each migrated page the values will be updated.
Those values will change over the course of the migration. If the migration starts with pages that have no attachments, you might see great migration times of maybe 5 seconds per page. But if suddenly pages start to have dozens of attachments, each a couple of megabytes in size, times will go up.
Estimate before migrating
Use the Migration Duration Estimator to forecast the migration duration before starting.Black console window and log files
Looking at the black console window you’ll get more numbers than in the blue WikiTraccs.GUI window.
You can see those numbers in the common log files as well, as everything shown in the console window is stored there. You can open and look at those log files while the migration is running.
Live metrics calculated after each migrated page
Note: those metrics are available as of WikiTraccs 1.22.1
Note: as WikiTraccs evolves, the available metrics and wording will change and evolve as well.
WikiTraccs measures the time it spends on different migration-related activities. Different metrics are calculated from thsoe times.
Those metrics are supposed to roughly show how fast the migration is going over a period of time, as well as some additional insights. This can predict future migration times, but only if pages are similar with respect to certain metrics.
Here’s a sample:
[023 21:32:46 DBG MIG  ] [https://contoso.atlassian.net/wiki] Metrics FROM THE LAST 60 MINUTES, covering 21 page-like contents ("items"):
Median time (IQR)    : 23 s/item
Median time          : 55 s/item
75th percentile (IQR): 87 s/item
75th percentile      : 132 s/item
Mean time (IQR)      : 68 s/item
Mean time            : 90 s/item
Items per hour       : 41-156 (based on IQR Median and IQR 75th percentile)
Avg links transformed: 2/item
Have files           : 59% of items
File count avg       : 23.9 per item that has files
File size avg        : 502 KB/file
Download speed       : ~451 KB/s
Upload speed         : ~91 KB/s
File size sum down   : 305.8 MB
File size sum up     : 1911.6 MB
Estimated time left for the remaining 322 items: 2.1-7.8 hours (ETA: 12/11/2024 23:36 - 12/12/2024 05:19) (based on IQR Median and 75th percentile)
[023 21:32:46 DBG MIG  ] [https://contoso.atlassian.net/wiki] Time spent in the last 60 minutes (excerpt, overlapping, excluding outliers):
(SharePoint, File, Content)                                 : 11.58 min
(Confluence, File, Content)                                 : 3.19 min
(SharePoint, Page, Content)                                 : 2.03 min
(Confluence, Page, Transformation_Macro_Other)              : 1.57 min
(Confluence, Page, Link_Soft)                               : 0.97 min
(SharePoint, WikiTraccs, Prerequisites)                     : 0.67 min
(SharePoint, Page, Principal)                               : 0.55 min
(Confluence, Page, Principal)                               : 0.47 min
(SharePoint, Page, Metadata)                                : 0.47 min
(SharePoint, File, Metadata)                                : 0.28 min
(SharePoint, Workspace, Metadata)                           : 0.26 min
(Confluence, Page, Transformation_UserMention)              : 0.26 min
(SharePoint, Page, Stub)                                    : 0.25 min
(SharePoint, Page, Configuration)                           : 0.23 min
(Confluence, Page, Link_Hard)                               : 0.21 min
(Confluence, Page, Comments)                                : 0.20 min
(SharePoint, File, Principal)                               : 0.17 min
(Confluence, Page, Permission)                              : 0.14 min
(Confluence, Page, Content)                                 : 0.13 min
(Confluence, Page, Tree)                                    : 0.09 min
Details about above values:
| Metric | Meaning |
|---|---|
| Median time | Median migration time per page |
| Median time (IQR) | Median migration time per page, after removing outliers |
| 75th percentile | 75th percentile of page migration times |
| 75th percentile (IQR) | 75th percentile of page migration times, after removing outliers |
| Mean time | Average migration time per page |
| Mean time (IQR) | Average migration time per page, after removing outliers |
| Items per hour | Pages migrated per hour, based on IQR Median and IQR 75th percentile |
| Avg links transformed | The average number of links on those pages; links increase migration times |
| Have files | The percentage of pages that have attachments or link to external images |
| File count avg | The average number of files that were uploaded per page (of the pages that have any files) |
| File size avg | The average file size |
| Download speed | Average download speed for downloaded files |
| Upload speed | Average upload speed when uploading files to SharePoint Online; this also includes several metadata operations, so it will be lower that the ‘raw’ file content upload speed would be |
| File size sum down | An indicator of downloaded file content; this is not exhaustive and accuracy will be improved in a future release |
| File size sum up | An indicator of uploaded file content; this is not exhaustive and accuracy will be improved in a future release |
Following those metrics is a list of transformation operations that WikiTraccs spent time on. This is a rough indicator of how much time each operation takes.
Most time will probably be spent on (SharePoint, File, Content), which includes file upload to SharePoint, (Confluence, File, Content), which includes attachment download from Confluence, and (SharePoint, Page, Content), which includes SharePoint page creation.
Those values can and will overlap, so their sum will be higher than the actual time spent. For example uploading page content and resolving links can happen in parallel.
Note
Those values are supposed to make transparent where WikiTraccs spends its time. They could also hint at potential points for optimization.
If you think another metric could be valuable in above list, get in touch, I’d like to hear about your use case.
Live progress for large attachment lists
If WikiTraccs migrates a page with lots of attachments (“lots” being ~50 and more), you will see intermittend progress output like this:
Applied provisioning chunk 3/4; handled 41/53 of files; that's 46.6 files per minute and 0.3 minutes to go
This shows the number of already uploaded files (41 of 53), how many files per minute have been uploaded (46.6), and - based on those numbers - an estimated finish time (in 0.3 minutes).
Note
WikiTraccs optimizes file uploads. Files are uploaded to SharePoint Online in parallel, 2 files at a time.
You can configure more files to be uploaded in parallel, but might get throttled faster by Microsoft. Use the WiggleRoom.ParallelFileOperationsCount configuration parameter in appsettings.json to increase the parallelism count. Experience shows, though, that this doesn’t make much of a difference.